Stellar Submissions is a series of articles by MetricsDAO wherein we highlight bounty submission best practices by showcasing the grand prize winners of our bounty programs. Our goal with this is to sharpen the skills of on-chain analysts and raise the overall quality of bounty submissions.
This edition of Stellar Submissions is a continuation of MetricsDAO’s Uniswap Bounty Program. We put the spotlight on grand prize winners of the third round.
Grand Prize Winners
1. Mixing Macro- and Micro- Level
Analysis: UNI Market Correlation
Author: Adria Parcerisas
Guess who’s back… back again… Adria’s back… tell a fren.
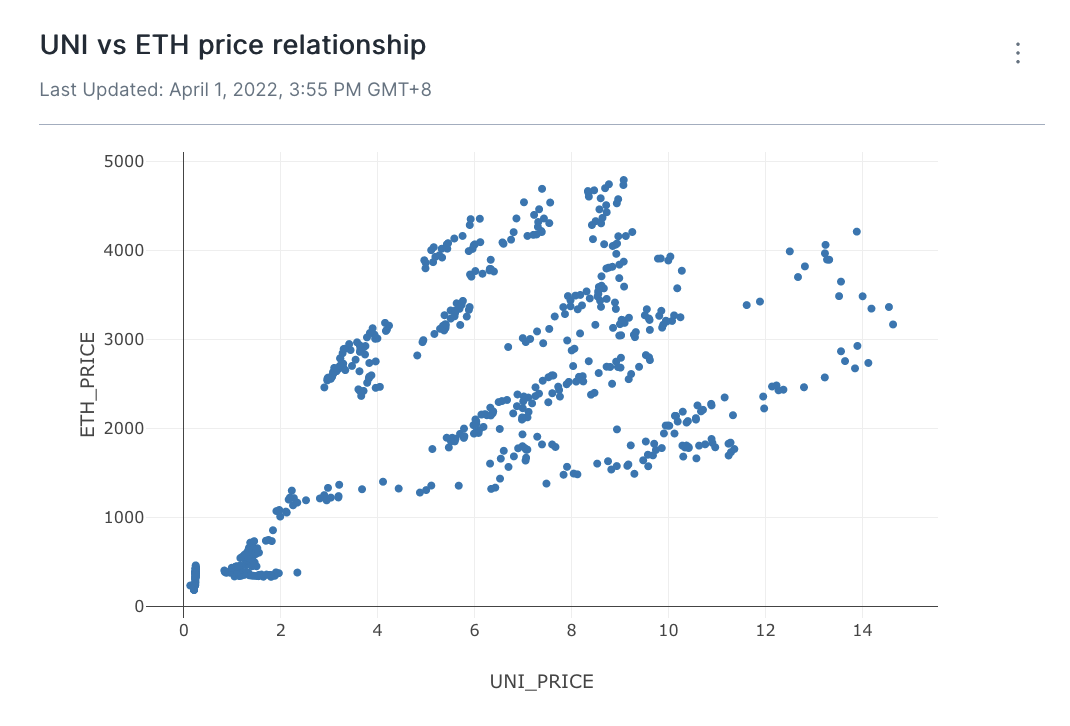
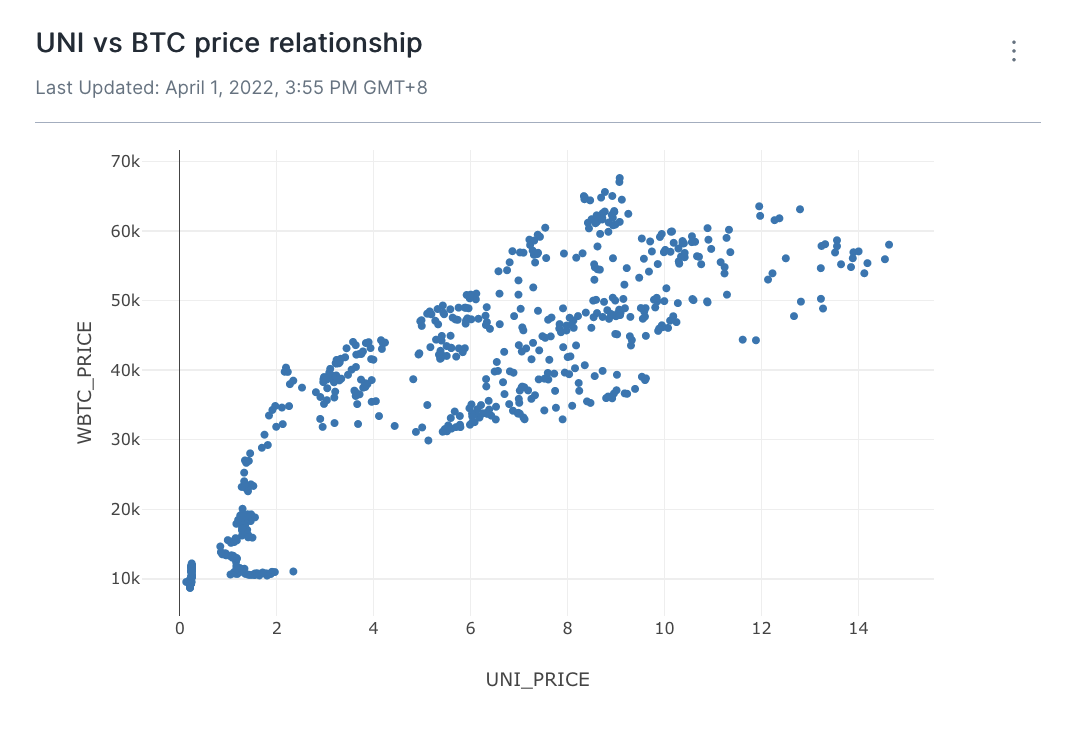
In this analysis, Adria looks at the correlation between the prices of UNI and BTC + ETH. He also dives into the correlation of the price of UNI and the native tokens of other DEX’s and aggregators such as SUSHI (Sushiswap), 1INCH (1inch), and CRV (Curve).
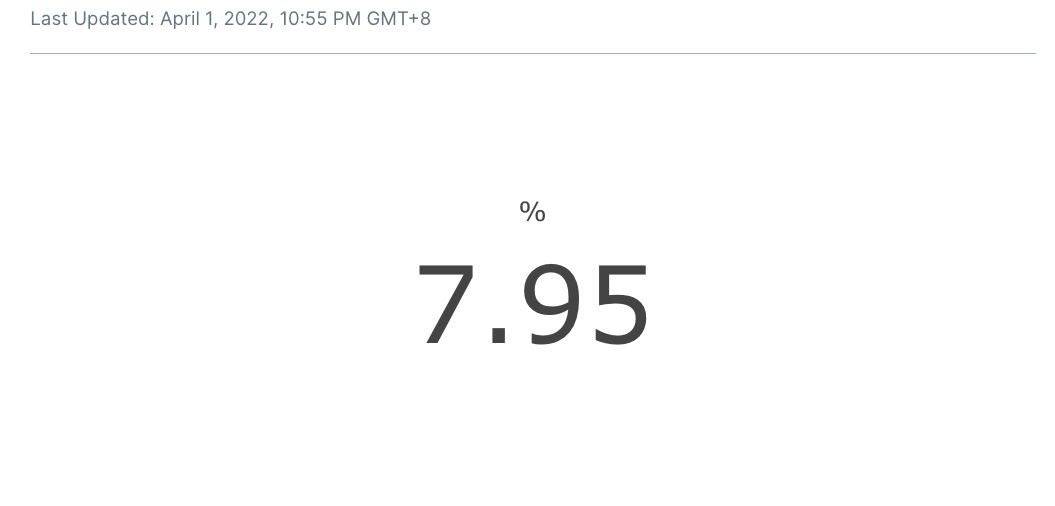
It is widely known that BTC and ETH are the bellwether assets when it comes to the crypto market, meaning the price action of most other crypto assets tends to move closely with the prices of these two. Based on Adria’s analysis, UNI is no different as evidenced by its 0.884 correlation with BTC and ETH.
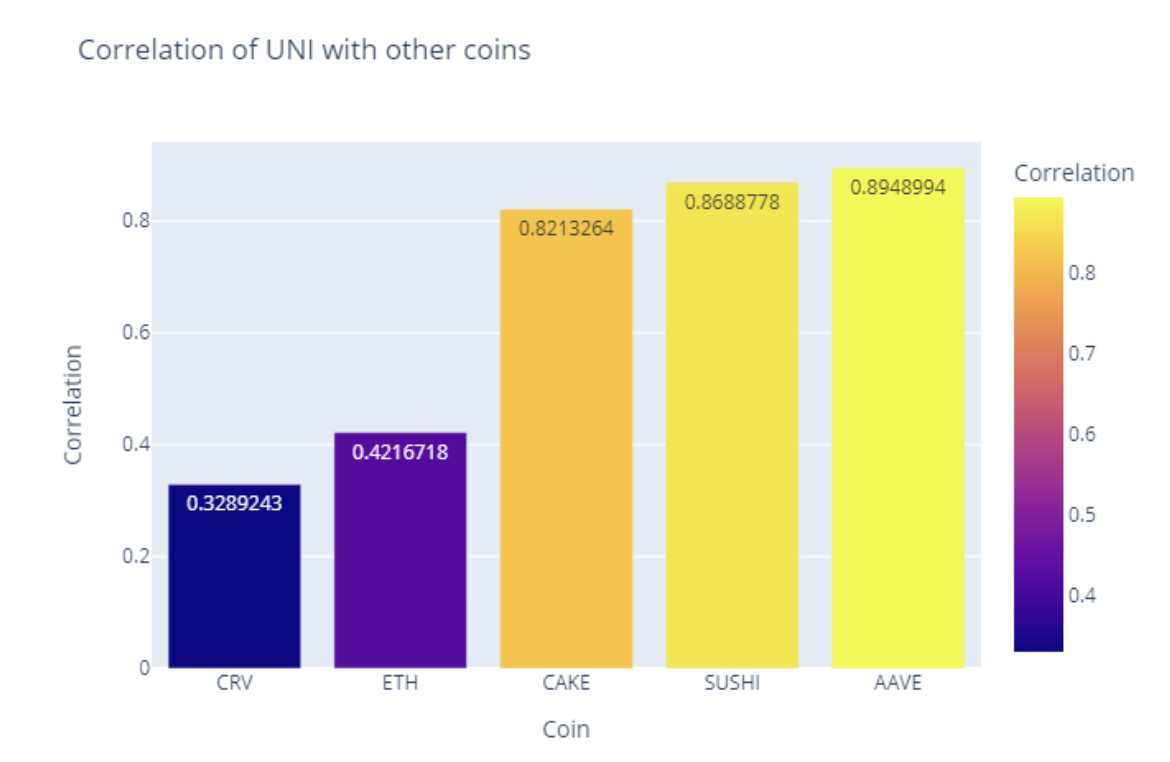
He then takes a closer look at the correlation between UNI and other DEX’s/aggregators.
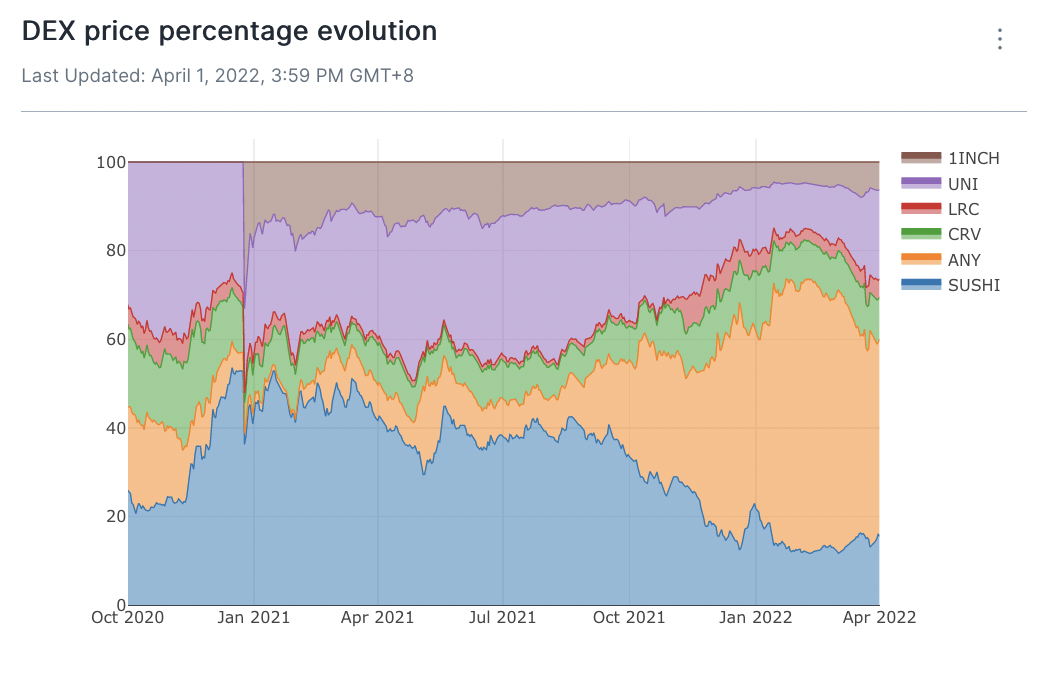
Here we find out that UNI’s price is closely correlated with 1INCH and SUSHI, but not CRV. This is most likely because the first two cater to the same markets and offer similar services (Sushiswap is a fork of Uniswap and 1inch aggregates DEX’s, including Uniswap, the market leader). Meanwhile, Curve specializes in stablecoin trades and its CRV token has more utility and monetary returns unlike UNI.
This submission demonstrates Adria’s ability to use both macro- and micro-level perspectives to drive the context. He starts off with a general market view using BTC and ETH, then looks into DEX’s in general, and finally zooms into specific assets. This enables him to build a comprehensive analysis.
Check out other interesting findings here including how exactly (un)correlated UNI and CRV are.
2. Take things from a different perspective
Analysis: UNI Market Correlation
Author: tio91
tio91 also explores possible correlations between UNI and other assets. They first compare UNI with ETH and then with other native assets of other DEXs/aggregators, specifically SUSHI (Sushiswap), AAVE (Aave), 1INCH (1inch), and CRV (Curve).
What makes this analysis different are the metrics tio91 used to demonstrate correlation. First, instead of directly calculating the correlation, they used the lowest average growth rate difference between the prices of the individual assets and UNI. Using this, we see that AAVE is the most closely correlated asset as it has the smallest difference.
The next metric is the highest number of weeks with the closest growth rate among the assets. This time it shows that ETH is most closely correlated with UNI.
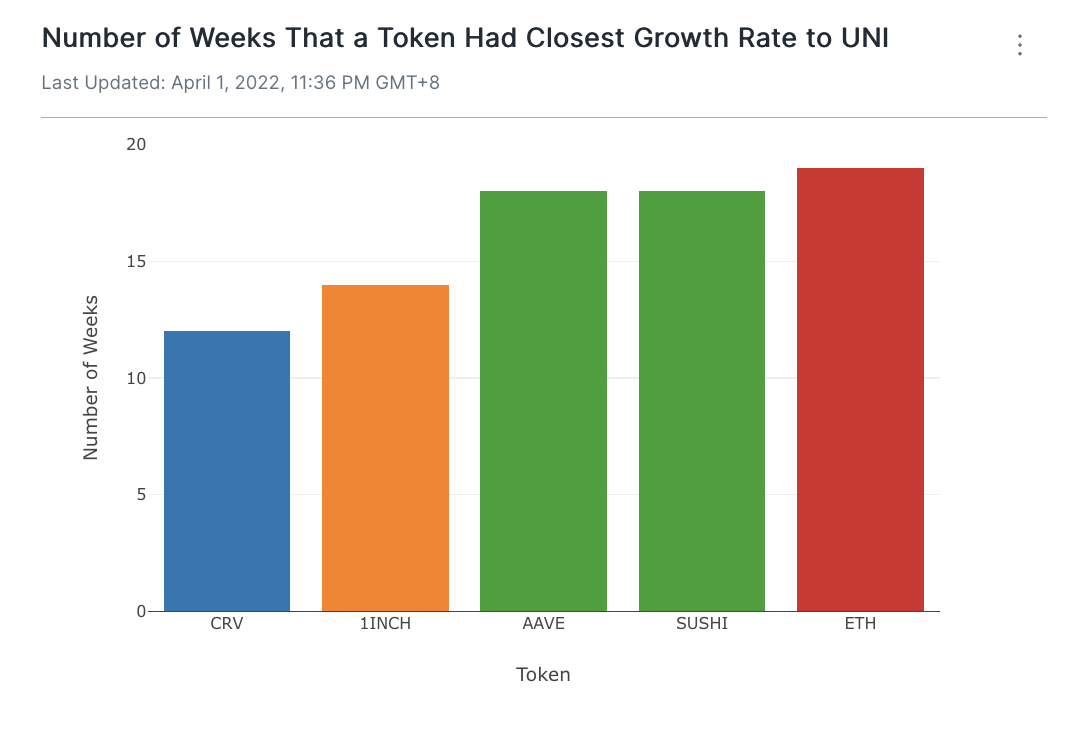
Using these metrics gives this analysis a unique flavor compared to a straightforward correlation exercise. While that might be a risk in the context of a bounty depending on the strictness of definitions, it cannot be denied that this approach brought forth valuable insights based on this analysis.
To find out how closely related other assets are to UNI, check out the full dashboard here.
3. Unique approaches yield unique insights
Analysis: UNI Market Correlation
Author: doing
Speaking of unique approaches, doing also looks into the correlation of the price of UNI and other assets but goes about it differently.
What sets his analysis apart are the approach and perspectives he took, and the dataset used. First, he used a different dataset from the norm, getting data directly from centralized exchange Binance instead of data providers like Dune and Flipside. Then instead of just analyzing the data over a specific period of time and calling it a day, he dove in further and isolated the data during certain market conditions.
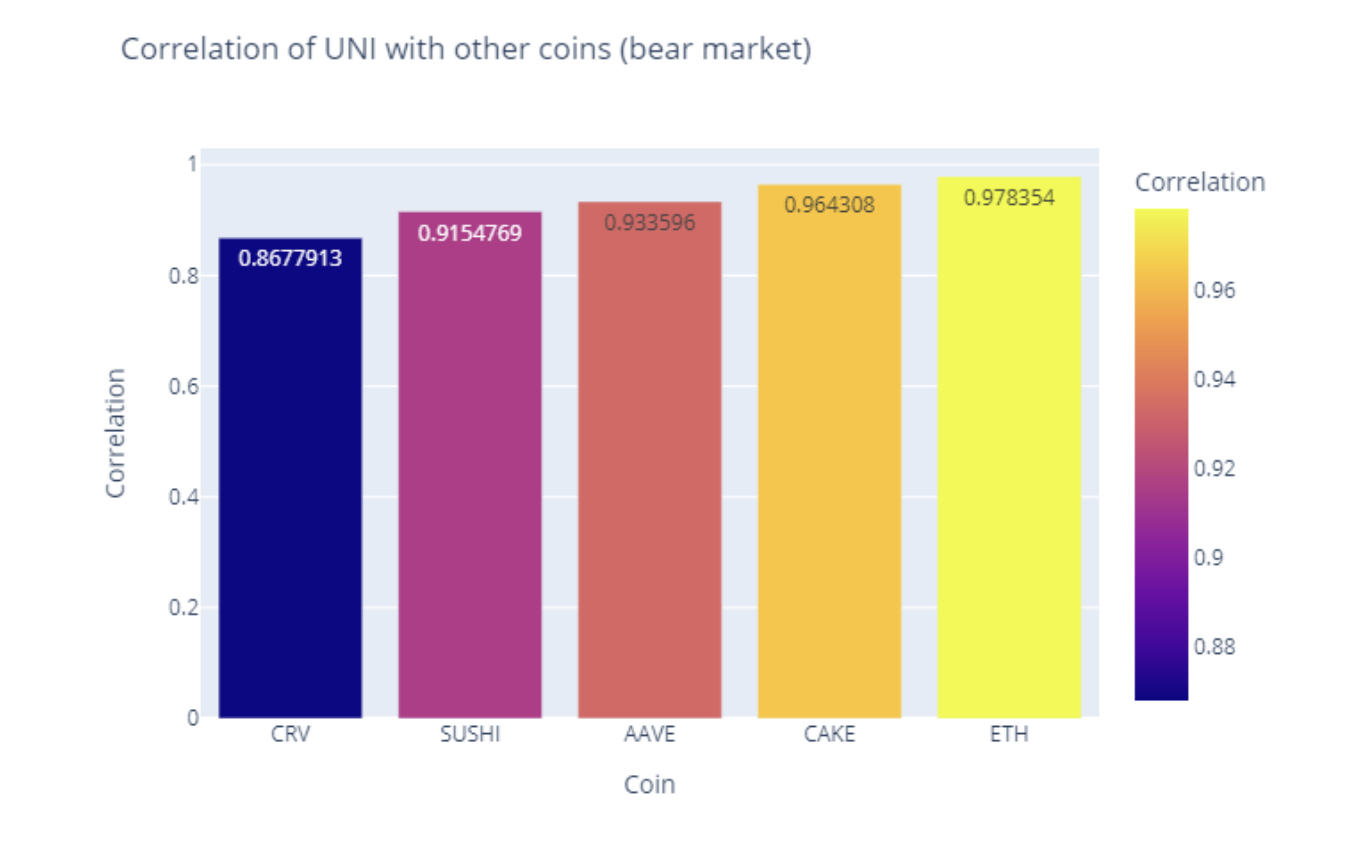
During the period marked by bearish sentiment from May to July 2021, doing shows that the assets are significantly more correlated to one another and to UNI. This is true even for CRV wherein previously, we saw how uncorrelated it was to UNI due to perhaps Curve’s market and its value accrual mechanism.
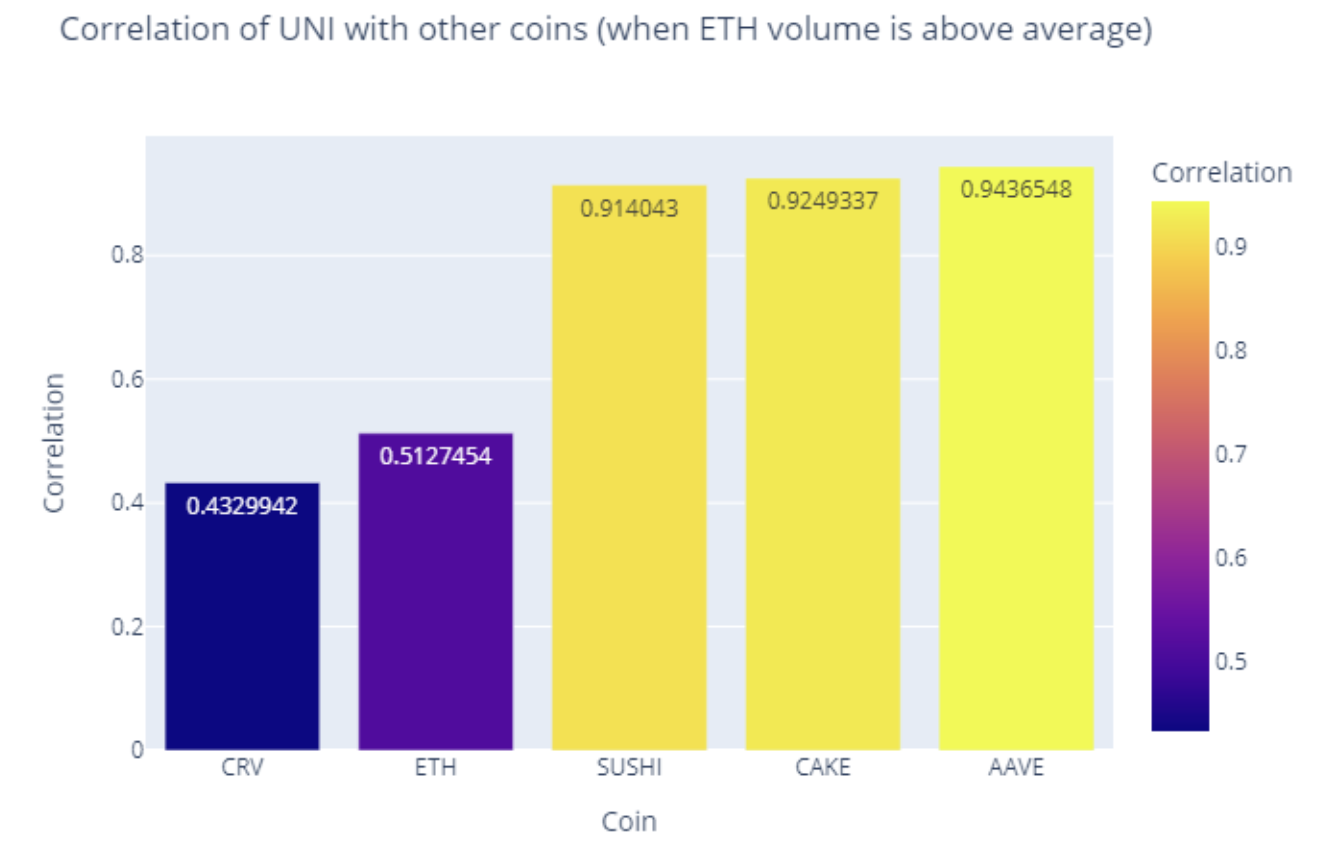
During the times when ETH trading volume is above average, there is also a slight correlation bump between the assets and UNI but not as much as during down periods.
This submission is a perfect example of how taking a different approach can uncover more unique insights. From the dataset and tools used, to the actual time periods analyzed, the analyst was able to surface deeper insights to the audience. We now know that market conditions can indeed influence correlation of asset prices, especially during bear markets.
Check out the complete analysis here and find out which of these assets have a long-term relation with UNI.
4. Ensure that the context is complete
Analysis: Impact of Uniswap Activity on UNI Price
Author: Zook
With the focus still on UNI prices, this analysis takes a look at how the activity on Uniswap can possibly affect the price of UNI. Specifically, Zook uses data from 2022 Jan 1 to March 27, 2022. He first looks into the daily swap volumes on Uniswap v2 and v3.
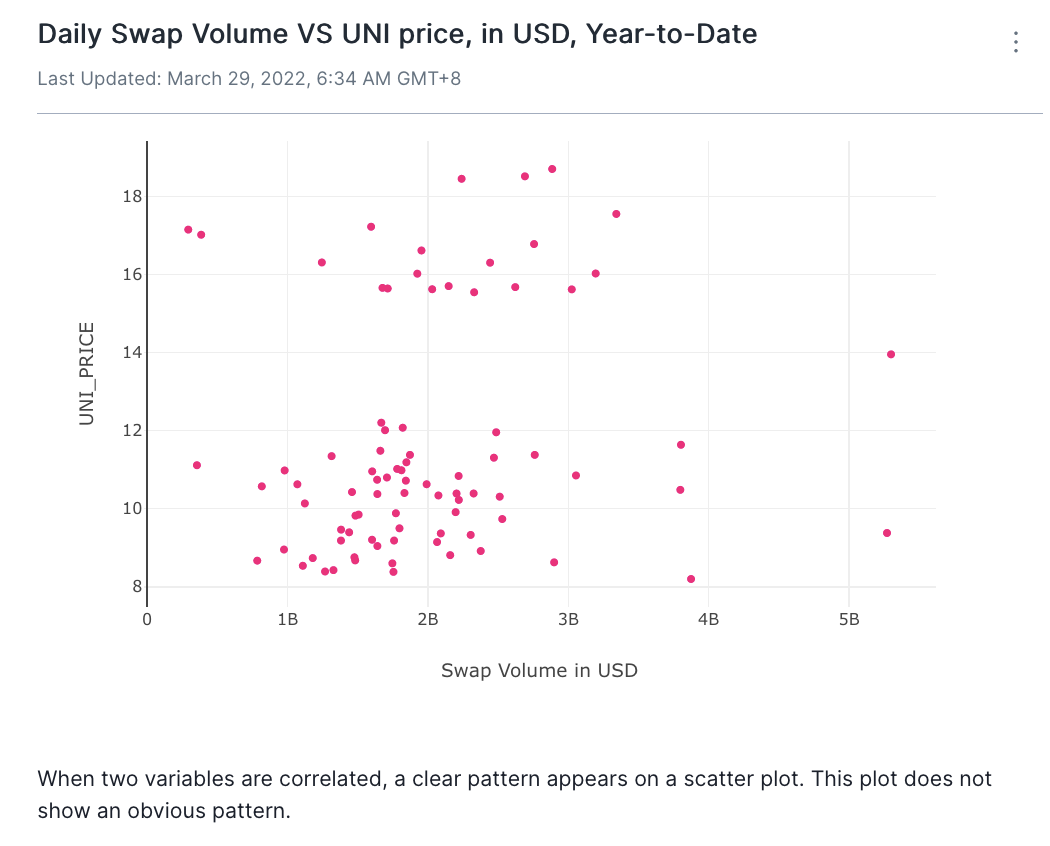
We can see that there is no obvious relationship between the swap volumes on Uniswap and the price of UNI, meaning trading volume does not influence the price of the token.
Next, he looks into the net liquidity actions per day on Uniswap v3. This is defined as the number of actions that added liquidity to the protocol subtracted by the number of actions that removed liquidity from the protocol.
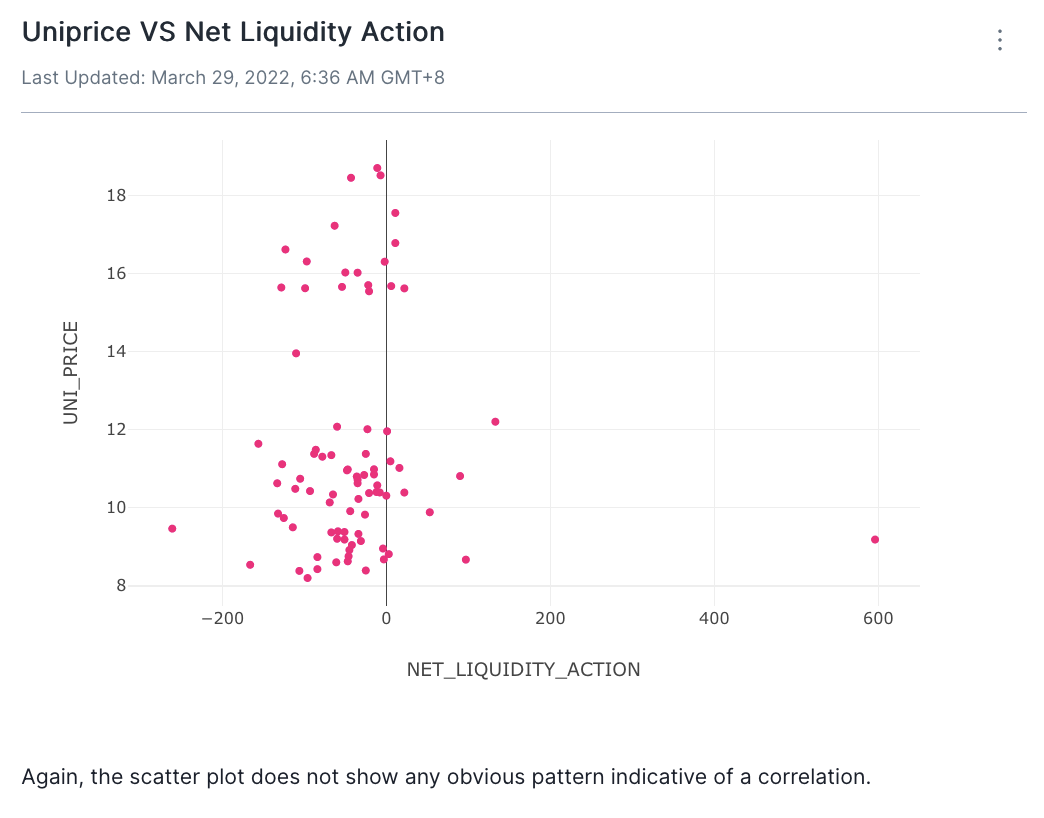
As with trading volume, liquidity actions do not have an effect on the UNI price.
From here, it would be fine to conclude the analysis and say that the level of usage during the period does not affect the price of UNI. But one of the things that make this submission stand out is that Zook further drives the point home and completes the analysis by also showing how this behavior compares to Uniswap’s competitor, Sushiswap and its token.
This gives the audience a more complete context on whether the activity on a DEX can indeed influence its token price. Here you can see with Sushiswap, there is a higher correlation relative to Uniswap.
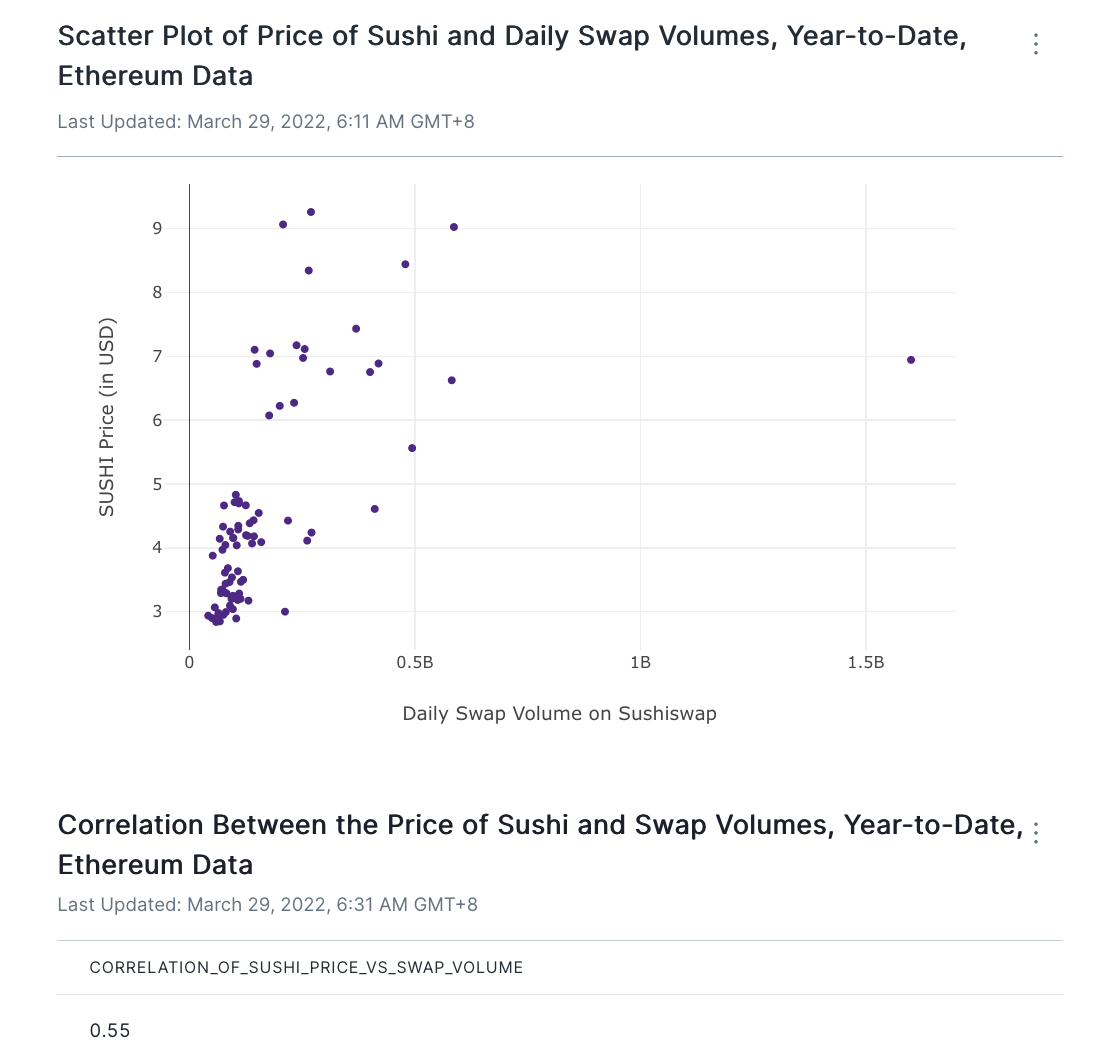
The analyst points out that this could be because of the different tokenomics of the assets wherein SUSHI holders are entitled to 0.03% of the trading fees charged by Sushiswap while UNI token holders can only participate in governance.
3 Key Takeaways
-
Be different
As previously mentioned, the best insights can sometimes be only uncovered when taking a unique approach to the problem and offering multiple perspectives to the audience. The key here is to be clear with the metrics used and how they are defined. However, do not be different just for the sake of it. Keep the goal of the analysis in mind.
-
Keep the context in mind
The context neatly ties an analysis together. Do not be afraid to go the extra mile to offer a complete picture to the audience, whether that is analyzing additional related data points or simply doing further research on a topic.
-
Explore other datasets
Related to the previous points, feel free to use other datasets as well. While bounty submissions commonly use platforms like Dune or Flipside due to their reliability and robustness, nothing is stopping you from checking out other data sources that might have previously undiscovered insights. There is plenty of data out there so always be curious.
Complete Set of Uniswap Grand Prize Winners (third round)
- UNI Market Correlation by Adria Parcerisas
- UNI Market Correlation by tio91
- UNI Market Correlation by doing
- Impact of Uniswap Activity on UNI Price by Zook
Ready to take on some bounties? MetricsDAO’s Olympus bounty program is still ongoing. Check them out here.
–
Want to share your own tips and best practices? Maybe you are ready to participate in a bounty program? Hop on over to the MetricsDAO Discord or follow us on Twitter to find out more.